by Donatella Saccone, University of Turin and OEET
Sintesi
Comparando i livelli medi di reddito pro capite e i tassi medi di crescita economica nel periodo 2000-15, l’analisi propone una definizione empirica di economie emergenti basata su due criteri principali: a) livello medio del reddito pro capite inferiore alla media mondiale e b) tasso medio di crescita economica superiore alla stessa. In totale, vengono individuati 38 paesi con la seguente distribuzione geografica: 13 in Europa e Asia centrale, 8 in Asia orientale, 8 in Africa Subsahariana, 5 in America Latina, 3 in Asia meridionale, 1 in Nordafrica. L’analisi poi compara il gruppo di economie emergenti al resto del mondo avvalendosi di alcuni indicatori economici, sociali, istituzionali e politici.
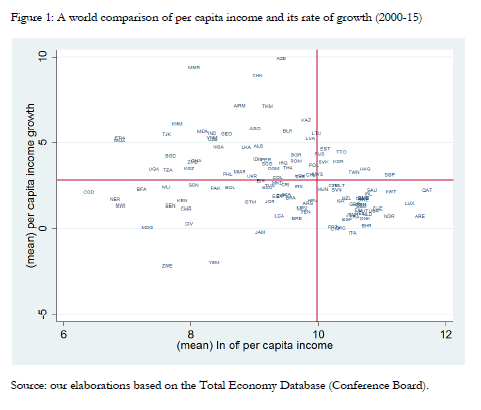
By comparing countries’ per capita income levels and their rates of growth in a given period of time, we can divide the world into four categories, as illustrated in figure 1:
1) countries with a mean per capita income level and a mean rate of growth lower than the world average (low income-low growth countries);
2) countries with a mean per capita income level lower but a mean rate of growth higher than the world average (low income-high growth countries);
3) countries with a mean per capita income level and a mean rate of growth higher than the world average (high income-high growth countries);
4) countries with a mean per capita income level higher but a mean rate of growth lower than the world average (high income-low growth countries) *.
Following this approach, in a recent article I propose a basic and inclusive empirical definition of emerging economies (Saccone, 2016). After calculating the mean values for the last 15 years, I define emerging the economies belonging to category 2, i.e. those economies that have presented a mean per capita income level lower than the world average but a mean rate of growth above the world average. However, since we have to take into account that sometimes high growth rates are just the reflection of the recovery that follows an economic crisis, I exclude from the group of emerging economies those countries that suffered from a period of recession in the ‘90s and have not yet recovered the pre-crisis levels of real GDP per capita.
Here, I apply this approach to the period 2000-15, using a sample of 122 countries. Data on GDP with EKS PPP are obtained from the Total Economy Database (Conference Board). The two threshold values for the GDP per capita and its rate of growth, corresponding to the sample means, are respectively 21451 $ PPP and 2.8%. The partition of countries into the four above-mentioned categories is represented in Figure 1, where the two red lines represent the sample means. The group of economies that over the last 15 years have been characterized by low income and low growth is composed by 34 countries (13 in Sub-Saharan Africa, 11 in Latin America, 6 in Middle East and North Africa, 3 in Europe and Central Asia, and 1 in South Asia). The virtuous group of high income-high growth economies counts 9 countries (5 in East Asia, 3 in Europe and Central Asia, and 1 in Latin America). Thirty-five countries assemble the group of mature economies that have presented high income but low growth (22 in Europe and Central Asia, 8 in Middle East, 3 in East Asia, and 2 in North America).
The group of low income-high growth economies includes 44 countries (see Appendix 1 for the full list of countries by category). After excluding those countries that suffered from a period of recession in the ‘90s and have not yet recovered the pre-crisis levels of real GDP per capita, I obtain the group of emerging economies - 38 counties in total- with the following geographical distribution: 13 in Europe and Central Asia, 8 in East Asia, 8 in Sub-Saharan Africa, 5 in Latin America, 3 in South Asia, and 1in North Africa (see Table 1).
The group of emerging economies, with a mean GDP per capita of 8696 $, grew on average at a rate of 5%. If we look at the World Bank country classification by income group, that demarcates the distinction line between developing and developed countries, we can notice that 4 emerging economies are classified as low income, 14 as lower middle income, and 15 as upper middle income; moreover, we have 5 economies that, thanks to their economic emergence over the last 15 years, have now gained the status of high income, i.e. developed, countries (Chile, Latvia, Lithuania and Uruguay since 2012, and Poland since 2009).
Table 1: The group of emerging economies
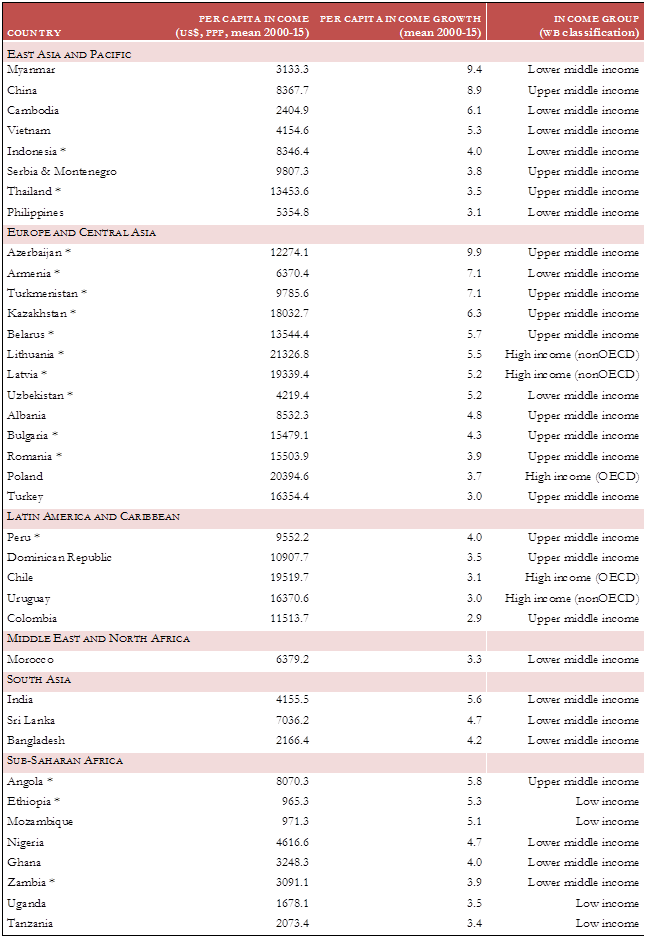
Source: Total Economy Database (Conference Board) and World Bank. * countries that were in a recession phase during the ‘90s but recovered the pre-crisis level of GDP per capita by the end of ’00s. We must look at them with special attention, since their high rates of growth may partially be an economic rebound after the period of recession.
Table 2 reports the sample mean of a series of economic and social indicators for the four groups of economies. Even if we cannot infer causality, it is interesting to notice how these indicators vary across the four groups. In general, from the table we can extrapolate the following final remarks:
Investment. Investment rates are higher in both groups of high-growth economies, and especially in high income-high growth countries, that are also characterized by a notable savings rate (35%).
Productivity. Emerging economies are characterized by a higher rate of productivity growth (4.8%), followed by high income-high growth countries (2.8%), while productivity is almost stagnant in the other two groups (low income-low growth and high-income-low growth).
Indicators of economic openness. The current account balance is negative in both low-income groups, including emerging economies. Moreover, the export rate, the technological content of exports and the net FDI inflows in emerging economies are still far from the levels of high-income economies and, especially, of high income-high growth countries.
Public indebtedness. High-growth economies are characterized by a lower central government debt (43% in emerging economies), while it is above 60% in both low income-low growth and high income-low growth economies.
Demographic indicators. Emerging economies still present high birth and fertility rates and, then, a high young-age dependency ratio. However, this may make them able to exploit the so-called demographic dividend in the future.
Migration. As obvious, migration flows move from low to high income economies, regardless of their rates of growth (below or above the world average).
Social indicators. In general, both income distribution and education access improve with the level of per capita income, but we can notice remarkable progress as we move from low income-low growth to low income-high growth economies (i.e. to emerging economies), especially with regard to the illiteracy rate (26% and 14%, respectively). However, inequalities in emerging economies remain at still high levels (Gini coefficient equal to 0.47).
Institutional indicators. Institutional quality, measured both by economic freedom indexes and democracy indicators, improve with the level of income.
Table 2: Some indicators by group of economies (sample means for the period 2000-15)
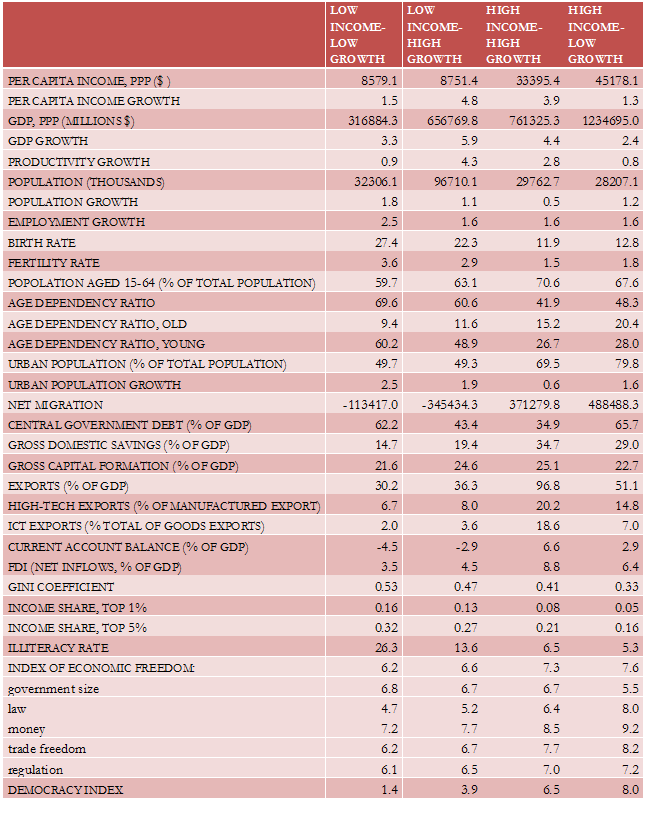
Source: Total Economy Database (Conference Board), WDI (World Bank), Global Income Dataset (Global Consumption and Income Project).
References
Saccone D. (2016), Economic Growth in Emerging Economies: What, Who And Why, Applied Economics Letters, on-line first, DOI: 10.1080/13504851.2016.1229407.
Deaglio M. (1993), The Poverty of Nations. A comparison between the 1965-80 and 1980-88 growth patterns in low income countries, Quaderni dell’Istituto di Economia Politica G. Prato, 10.
Lahoti R., Jayadev A., Reddy S.G. (2016), The Global Consumption and Income Project (GCIP): An Overview. Available at SSRN: https://ssrn.com/abstract=2480636.
Notes
* This methodology is inspired by Deaglio (1993). Deaglio calls “poverty area” the group 1), “take-off area” the group 2), “boom area” the group 3), and “opulence area” the group 4).
APPENDIX 1: LIST OF COUNTRIES BY CATEGORY (2000-15)
Low income, low growth
Algeria
Argentina
Barbados
Bolivia
Bosnia and Herzegovina
Brazil
Burkina Faso
Cameroon
Congo, Dem. Rep.
Costa Rica
Cote d'Ivoire
Croatia
Ecuador
Egypt, Arab. Rep.
Guatemala
Iran, Islamic Rep
Jamaica
Jordan
Kenya
Macedonia, FYR
Madagascar
Malawi
Mali
Mexico
Niger
Pakistan
Senegal
South Africa
St. Lucia
Sudan
Tunisia
Venezuela, RB
Yemen, Rep
Zimbabwe
Low income, high growth
Albania
Angola
Armenia
Azerbaijan
Bangladesh
Belarus
Bulgaria
Cambodia
Chile
China
Colombia
Dominican Republic
Ethiopia
Georgia *
Ghana
India
Indonesia
Iraq *
Kazakhstan
Kyrgyz Republic *
Latvia
Lithuania
Moldova *
Morocco
Mozambique
Myanmar
Nigeria
Peru
Philippines
Poland
Romania
Serbia & Montenegro
Sri Lanka
Tajikistan *
Tanzania
Thailand
Turkey
Turkmenistan
Uganda
Ukraine *
Uruguay
Uzbekistan
Vietnam
Zambia
* countries excluded by the group of emerging economies since they did not yet recover the pre-crisis level of GDP per capita, as better explained in the text.
High income, high growth
Estonia
Hong Kong SAR, China
Korea, Rep.
Malaysia
Russian Federation
Singapore
Slovak Republic
Trinidad and Tobago
Taiwan
High income, low growth
Australia
Austria
Bahrain
Belgium
Canada
Cyprus
Czech Republic
Denmark
Finland
France
Germany
Greece
Hungary
Iceland
Ireland
Israel
Italy
Japan
Kuwait
Luxembourg
Malta
Netherlands
New Zealand
Norway
Oman
Portugal
Qatar
Saudi Arabia
Slovenia
Spain
Sweden
Switzerland
United Arab Emirates
United Kingdom
United States