by Wladimir Andreff, University Paris 1 Panthéon Sorbonne *
Sintesi
Nel tempo sono stati proposti differenti campioni di economie emergenti. La convinzione dell’autore è che un campione specifico di economie emergenti sia valido solo se è adattato allo specifico scopo per cui viene proposto e se i criteri per identificarlo sono chiari e ben definiti. La nota ha lo scopo di proporre un campione di paesi selezionati sulla base dei loro investimenti diretti esteri in uscita e delle imprese multinazionali localizzate in questi paesi. Il campione, che comprende 13 paesi (Malesia, Messico, Cile, Tailandia, Colombia, Turchia, Argentina, Filippine, Indonesia, Nigeria, Egitto, Iran e Pakistan) è poi comparato al più noto gruppo dei BRICS. La nota discute infine analogie e differenze che caratterizzano il gruppo di economie sopra elencate.
Samples of emerging economies have been delineated on various criteria by different organisations such as the IMF, Boston Consulting Group, Standard & Poor’s, some banks and so on. Some researchers have proceeded by selecting the hard core common to previous samples (Andreff & Balcet, 2013).
Our point is that any sample of emerging economies is valid only if it is targeted toward a specific purpose and those criteria used to delineate it are crystal clear. The purpose here to gather a sample of ‘New-Wave Emerging Countries’ (NWECs) built up to be relevant from the standpoint of their outward foreign direct investment (OFDI) and multinational companies (MNCs) based in these countries, namely in comparison to BRICS’ OFDI and MNCs (Andreff, 2016).
For our purpose, first let us fix a threshold below which a country will not be regarded as a significant foreign investor in terms of OFDI. Though a little bit arbitrary, we retain the following criterion: a country is a significant OFDI home country if its OFDI stock is higher or equal to $1 billion in 2014 according to UNCTAD data published in the 2015 World Investment Report. With this threshold in mind, 91 countries in the world are screened and put into our data base.
We have to drop from this data base because they are not emerging economies: 30 developed market economies (DMEs) with a gross national income (GNI) per capita higher than $20,000 in 2014; the five BRICS which are only used for benchmarking the NWECs; 16 post-communist transition economies (PTEs) which are quite specific; and 17 rent-depending countries (RDCs) which economic development is entirely dependent on rent-extracting activities based on crude products (oil, gas, phosphates, copper mining, diamond mining, mineral fuels, etc.). Then we are left with 23 potential candidates for a NWEC sample.
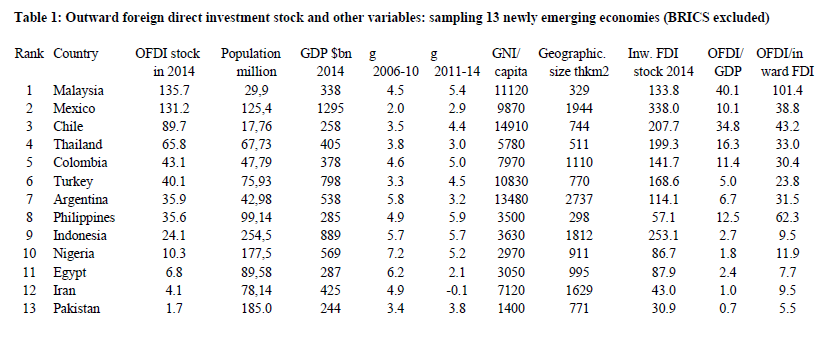
However 10 of the remaining countries are at odds with what BRICS are used to be: they have a small geographical size, a small population, a small GDP, and eventually they are task-friendly small economies (TFSEs) or tax heavens. Therefore our NWEC sample encompasses 13 countries: Malaysia, Mexico, Chile, Thailand, Colombia, Turkey, Argentina, Philippines, Indonesia, Nigeria, Egypt, Iran, Pakistan (Table 1).
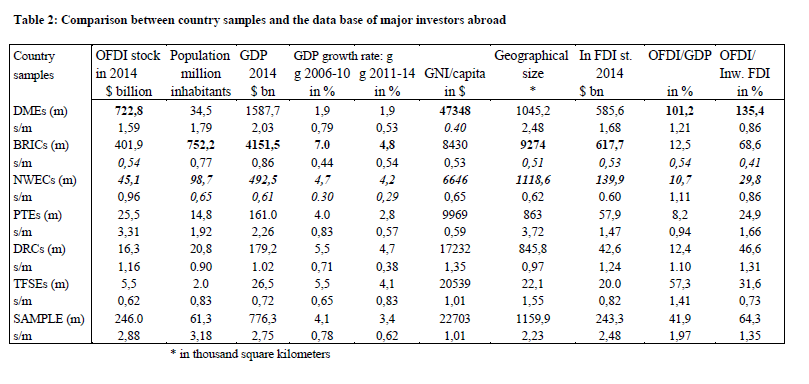
Then leaving a deductive approach, one has to check whether this sample is relevant which means that it should be homogenous enough from within and heterogeneous when compared to other country samples. We proceed here with statistical testing (Table 2). Quite logically, the ranking of country samples by OFDI importance is not very much different from their ranking by average GNI per capita: the first ranked are DMEs (average GNI per capita = $47,348), then come PTEs ($9,969), BRICS ($8,430) and NWECs ($6,646). Of course, GNI per capita is inflated by the rent in RDCs ($17,232) and by tax/custom duty attractiveness in TFSEs ($20,539) which nevertheless remain below the average for the whole database of significant foreign investors. Such country sampling is relevant from the standpoint of both OFDI and economic development (GNI per capita) since the variation coefficient s/m (m = mean value, s = standard deviation) is below 0.66 for DMEs, BRICS, PTES and NWECs; each sample is rather homogeneous compared to the whole data base (its s/m = 1.01).
Two other interesting features show up in Table 2: on average, BRICS have a huge population (752 million inhabitants) and the biggest average geographical size (9,274 thousands square kilometers). The next biggest countries in terms of average population are the NWECs (99 million inhabitants) while population is much smaller in DMEs, and below 21 million inhabitants in DRCs, 15 million in PTEs and 2 million in TFSEs. The NWECs are also the second biggest countries on average in terms of geographical size (1,118 thousands square kilometers) ahead of DMEs, PTEs and DRCs. Therefore, one can conclude that the NWECs have some similarities with BRICS. Moreover, the coefficient of variation is the lowest for the distribution of population in the NWECs sample, meaning that these countries are even more homogenous than BRICS in this respect.
Considering now the eight observed variables, it appears that the coefficient of variation (estimating the sample relative dispersion) is the lowest for the NWECs as regards population, GDP, GDP rate of growth in 2006-2010 and GDP rate of growth in 2011-2014 (Table 2). The lowest dispersion is witnessed in the BRICS group for geographical size, inward FDI stock and OFDI/GDP and OFDI/inward FDI ratios. However, the second lowest dispersion (and very close to the BRICS’ coefficient of variation) is observed in the NWECs sample for geographical size and inward FDI stock. It is only for the OFDI/GDP and OFDI/inward FDI ratios that dispersion is the third lowest for the NWECs group. All in all, the NWECs are at least as homogenous a sample as the BRICS one. An OFDI stock 9 times smaller than the BRICS’ one probably means that the NWECs are emerging as major foreign investors; thus it makes sense to coining them New-Wave Emerging Countries from the standpoint of OFDI. The same applies to their GNI per capita ($6,646) rather close to the level of the BRICS’ one ($8,430).
Beyond the characteristics of being a homogeneous country group, the NWECs sample shares with the BRICS some marked disparities. GNI per capita spreads from $14,910 in Chile down to $1,400 in Pakistan; this is nearly as widespread as within the BRICS from a $13,220 GNI per capita in Russia down to $1,570 in India. In the NWECs, population is between 29.9 million inhabitants in Malaysia and 254.5 million inhabitants in Indonesia (a ratio of 1 to 8.5) while the gap is much deeper within the BRICS between 54 million inhabitants in South Africa and 1,364 million inhabitants in China (a ratio of 1 to 25). With regards to GDP, it is scattered among the NWECs from $244 billion in Pakistan to $1,295 billion in Mexico (1 to 5) whereas it spreads from $350 billion in South Africa up to $10,350 billion in China (1 to 30) among the BRICS.
The fastest growth rate in 2006-2010 scored at 7.2% in Nigeria as against 2.0% in Mexico in the NWECs (a 5.2% differential) whereas in the BRICS sample the growth rate was between 3.1% in South Africa and 11.3% in China (a 8.2% differential). In 2011-2014, the growth rate gap is the same in the two samples that is 6 percentage points (-0.1% in Iran and 5.9% in the Philippines; 2.1% in Brazil and 8.1% in China). All these figures show that: a/ there are noticeable disparities within the NWECs sample; b/ these disparities are narrower than in the BRICS sample. Lower disparity makes sense grouping the 13 selected countries as NWECs.
References
Andreff W. (2016), Outward foreign direct investment from New-Wave Emerging Countries: A shift of newly emerging multinational companies, OEET panel New challenges in large emerging economies, EACES Conference, Regensburg, 8-10 September.
Andreff W., Balcet G. (2013), Emerging Countries’ Multinational Companies Investing in Developed Countries: At odds with the HOS paradigm?, European Journal of Comparative Economics, 10 (1), 3-26.
* Wladimir Andreff is Emeritus Professor at the University Paris 1 Panthéon Sorbonne and EACES Honorary Member.