Velia Bigi[1], Elena Perra[2] and Giorgia Giovannetti[3]
Introduction
Arab countries are among those that have employed precautionary measures to tackle the diffusion of COVID-19, acting in advance to avoid the dramatic consequences of the virus. By exploiting new publicly available data sets, we obtained a real-time analysis of the economic and environmental consequences of the measures undertaken to tackle the spread of the COVID-19 pandemic. The empirical focus is on a selected group of countries in the Arab region, illustrative of the socio-dynamics of the area. This allows to “visualize” the regions that have been most negatively affected by the contagion containment measures, using near-real time data, such as the drop in emitted luminosity (NTLs) and the reduction in NO2 presence in the atmosphere as proxies for economic activity and urban settlement dynamics (Henderson, Storeygard and Weil, 2012).
This framework may offer policymakers significant insight enabling them to implement cost-effective, regionally targeted policies to help mitigate the economic damages caused by coronavirus. Moreover, an investigation on the potential correlation among the collapse of oil prices in the region, the drop in NO2 emissions and mobility trends data shows how these indicators are significantly interconnected. Finally, exploiting the estimated elasticities of GDP to variation in NTLs, as in Giovannetti and Perra (2020), we provide alternative measurements of GDP loss. By extrapolating GDP loss from the reduction in NTLs, different scenarios have been provided for each country, with slightly different projections with respect to those released by the International Monetary Fund (IMF) and the World Bank.
This article is an extract of the presentation on “The Covid-19 crisis in countries of the South shore of the Mediterranean” at the workshop on “Emerging economies during and beyond the Covid crisis: insights and perspectives”.
Related Literature
Addressing the urgency of the COVID-19 crisis calls for researchers to employ new digital millennium tools. The Day/Night Band (DNB) sensor of the Visible Infra-red Imaging Radiometer Suite (NOAA, 2013) is a valuable tool for extrapolating global daily measurements of nocturnal visible and near-infra-red lights, which can be used as effective proxies for economic activity (Henderson, Storeygard and Weil, 2012). The sensor represents a new generation of quality NTL products that allow for better monitoring of nighttime phenomena, giving new insights for applied studies (Levin and others, 2020). Equally, the European Space Agency (ESA) has recently released a new environmental air quality data set, collected through Sentinel-5P satellite using TROPOMI (a tropospheric monitoring instrument) (Goddard Earth Sciences Data and Information Services Center, 2019). Similarly, nitrogen dioxide (NO2), a trace-gas toxic component, may be considered a valuable proxy for human activities, since it is the result of anthropogenic events and natural processes, such fossil fuel combustion from vehicles and power plants, and also lighting (Ogen, 2020; Doll, Muller and Elvidge, 2000). The use of these alternative data sources is usually associated with countries with a weak statistical and administrative system—namely developing countries—which cannot rely on swift, solid and trustworthy data.
To build a holistic picture of the economic damages caused by the measures, these data were mapped for each country to show the change from pre- to post-lockdown/containment measures, both in terms of NTLs and NO2.
Key Findings
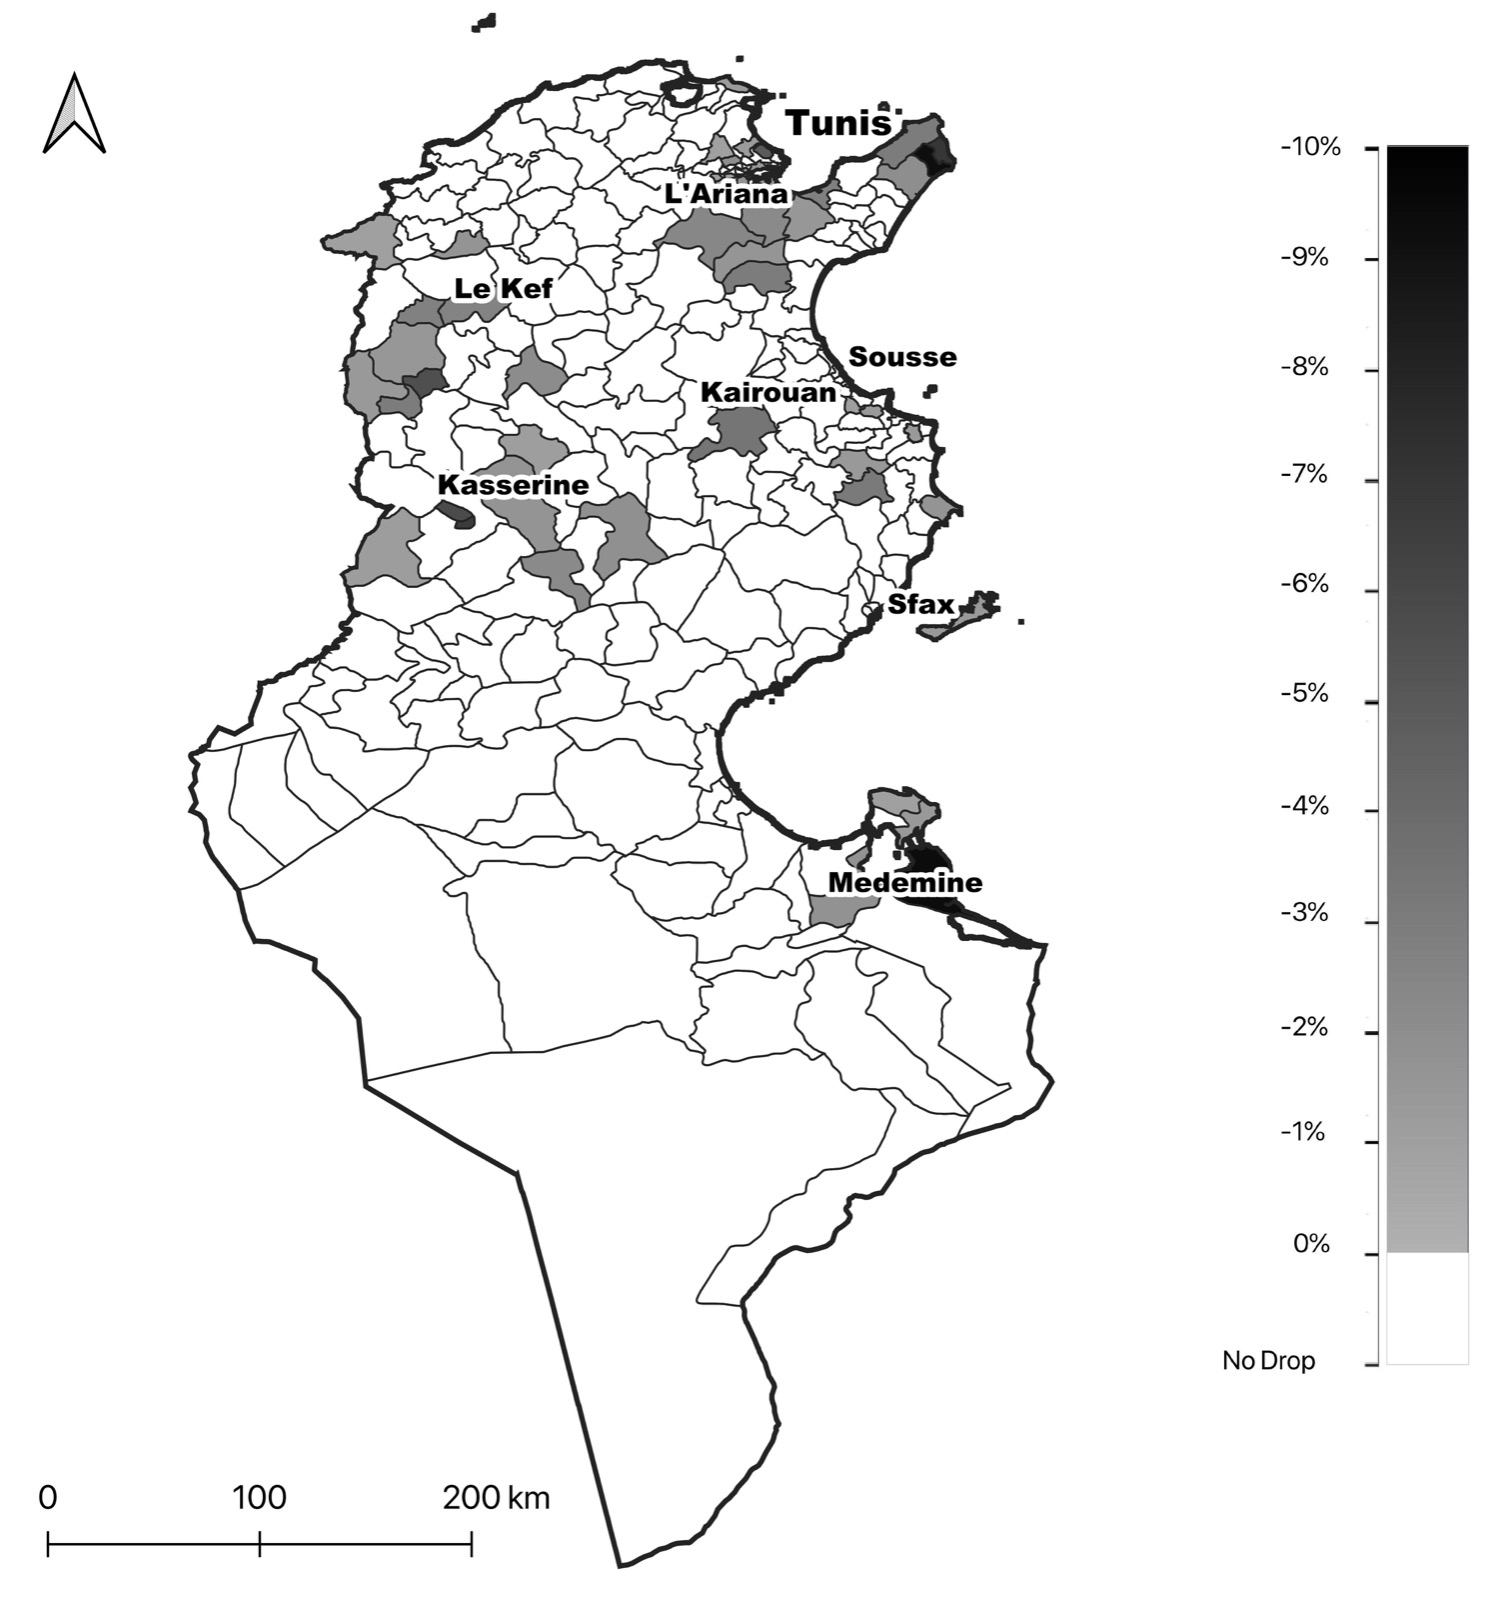
In the south shore of the Mediterranean, Tunisia, Morocco, Jordan and Egypt were severely hit by the pandemic in terms of production slowdown. Strong reductions registered in NO2 emissions seem to be consistent and severe across all the Tunisian territory, with an average NO2 emissions reduction of approximately -29.77%. The main touristic destinations are the most severely damaged by the lockdown. Tourism is the second largest contributor to the Tunisian economy, therefore the complete shutdown of all the premises may have had devastating consequences in terms of economic and social recovery. NO2 emissions have experienced a generalised and significant drop for all the Moroccan territory, averaging -39.28%. The most severe variations were concentrated in the main cities of Rabat, Tangier, Casablanca and Marrakesh. The observed drop in NTLs was around 1%, even though in some areas it peaked at 6.3%. The most affected places were the major population centres and tourist destinations. In Jordan, NO2 underwent an average negative drop of 42% for the most hit areas, but it stands on a countrywide average variation of -16%. The worst impacted areas were found in western Jordan, which borders with Israel and Palestine. All the major tourist attractions and tourist industry facilities are condensed within this strip. The registered drop in NTLs does not seem to involve the main city centres, but rather the areas surrounding the major tourist hubs, like Petra, Crusader Castle Montreal and Wadi Rum. Egypt is among the countries that have experienced the highest recorded drop in terms of NO2 emissions with an estimated average drop of -55.74%. The reduction in luminosity, meanwhile, has been less dramatic, at around 3–4%. However, the maps show that although the country has undergone a generalized reduction in both luminosity and emissions, the areas that have seen the worst impact are those that follow the course of the Nile. Similarly to Tunisia and Morocco, tourist hotspots in particular have been most affected by the crisis.
Figure 1. NO2 variation in Morocco
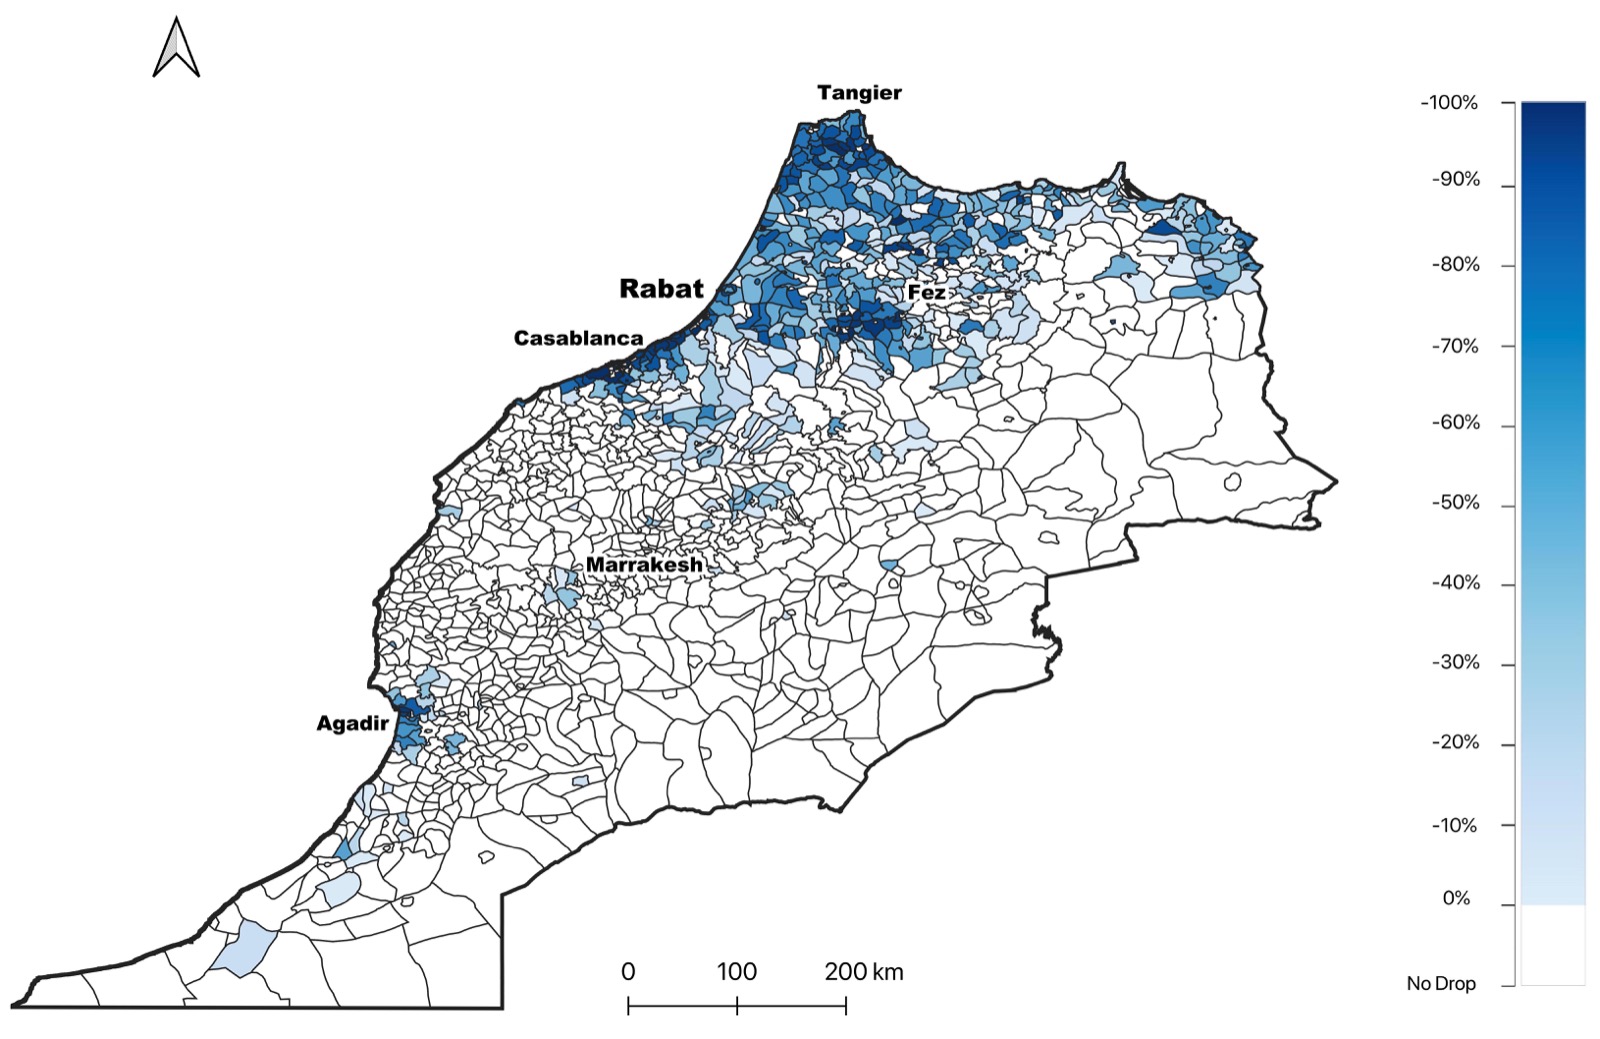
Figure 2. NO2 variation in Tunisia
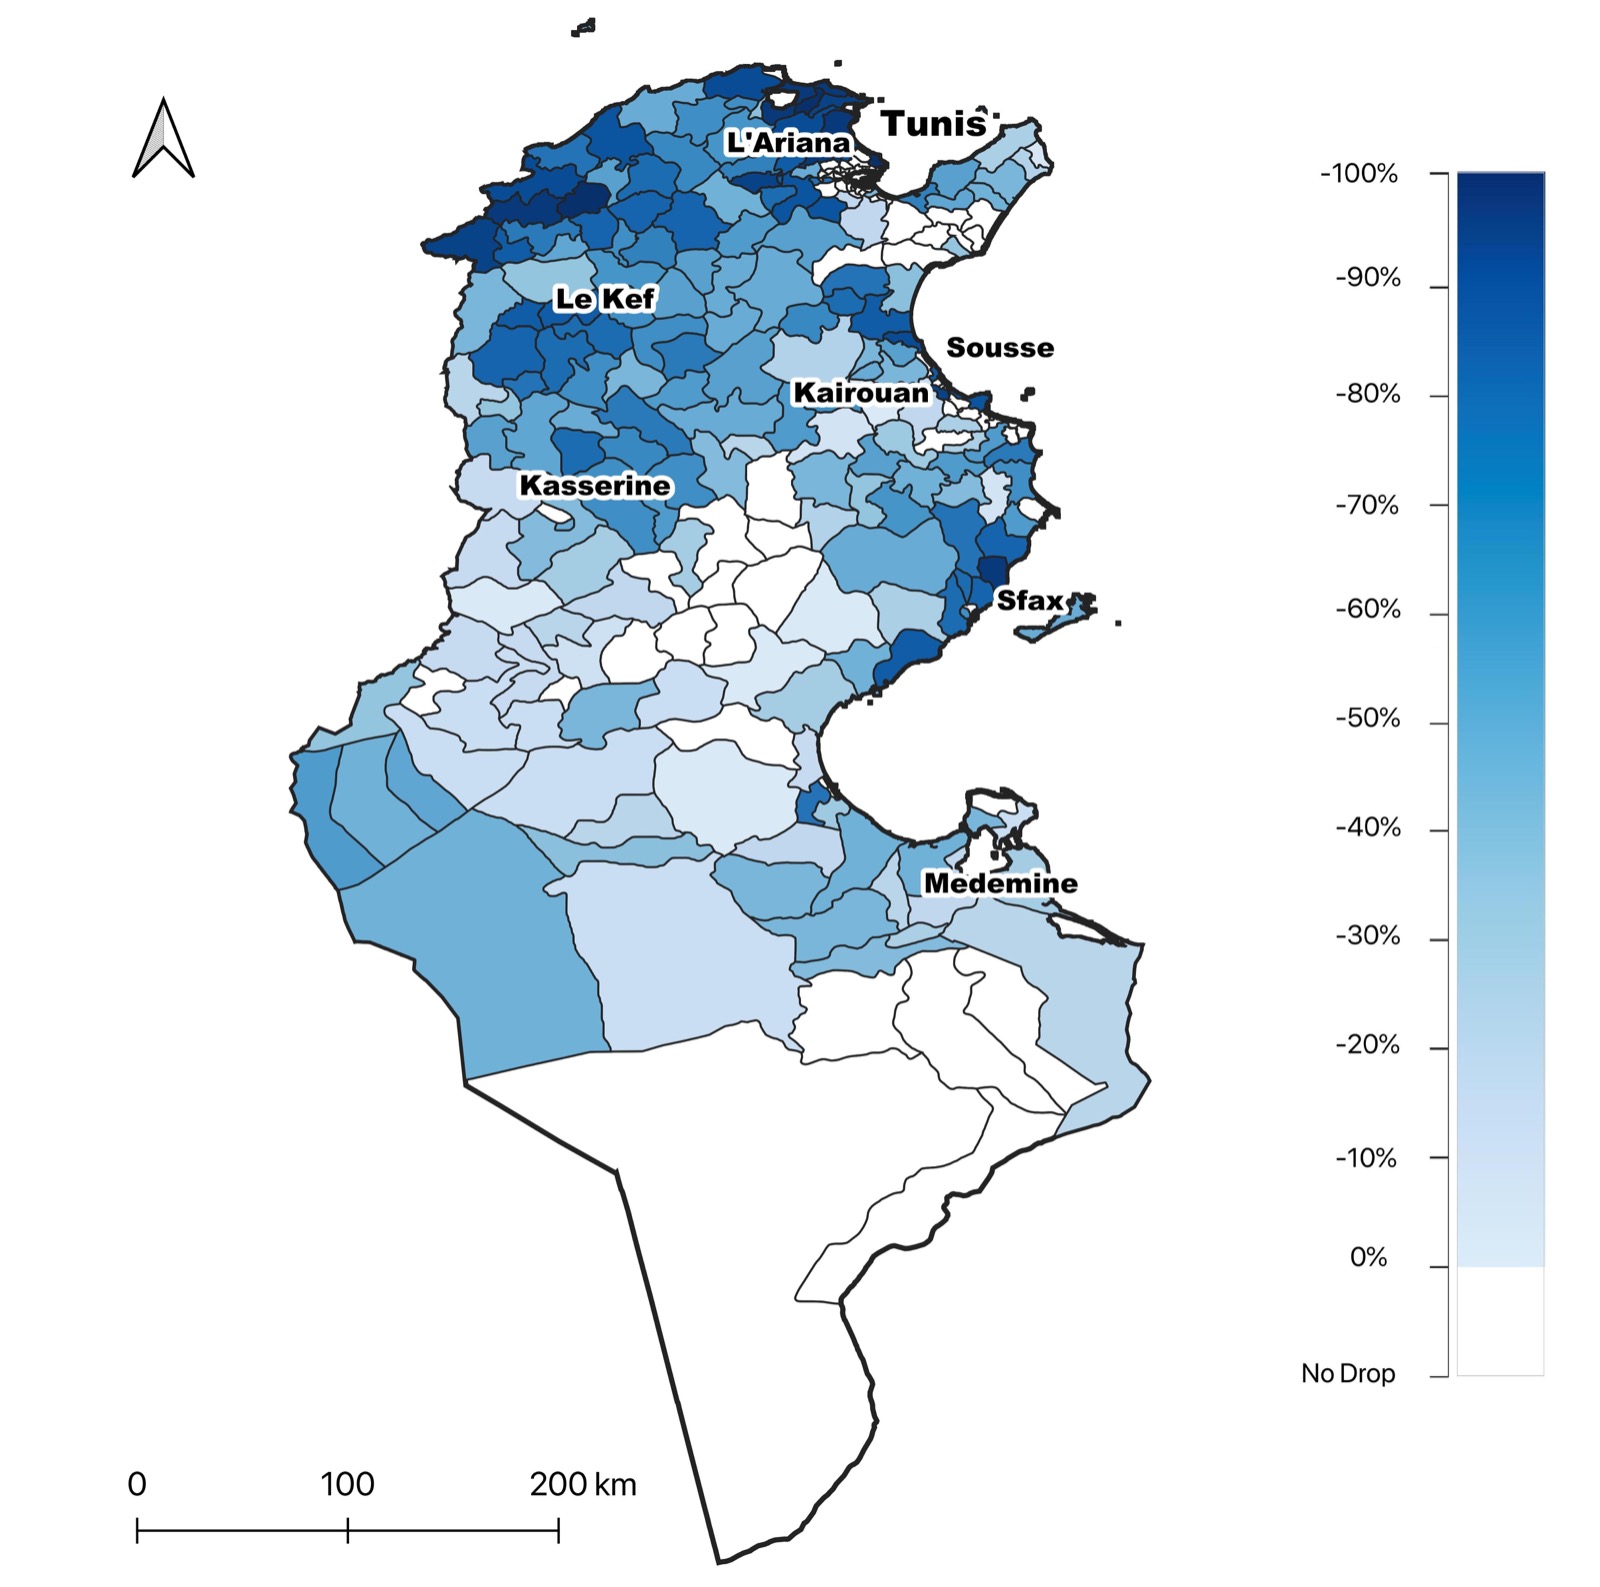
Figure 3. NTL variation in Morocco

Figure 4. NTL variation in Tunisia
Key conclusions and policy implications
The employment of satellite data may give significant new insights into the creation of alternative ways of measuring economic outcomes to assess the impact of exogenous shocks. At the same time, it is possible to identify the most affected areas, allowing to deploy specifically targeted economic and social policies which take into consideration the spatial heterogeneity of each country.
References
Doll, Christopher N. H., Ian-Peter Muller, and Christopher D. Elvidge (2000). ‘Night-time imagery as a tool for global mapping of socioeconomic parameters and greenhouse gas emissions’. AMBIO: A Journal of the Human Environment, vol. 29, No. 3 (May), pp. 157–162.
Giovannetti, Giorgia and Perra, Elena (2020). “Syria in the Dark: Estimating the Economic Consequences of the Civil War through Satellite-Derived Night Lights”.
Goddard Earth Sciences Data and Information Services Center (2019). ‘Sentinel-5P TROPOMI Tropospheric NO2 1-Orbit L2 5.5km x 3.5km’. Accessed on 24 August 2020.
Henderson, J. Vernon, Adam Storeygard, and David N. Weil (2012). ‘Measuring economic growth from outer space’. American Economic Review, vol. 102, No. 2 (April), pp. 994–1028.
Levin, Noam, and others (2020). ‘Remote sensing of night lights: A review and an outlook for the future’. Remote Sensing of Environment, vol. 237.
NOAA (2013) ‘Version 4 DMSP-OLS Nighttime Lights Time Series’. Accessed on 23 August 2020.
Ogen, Yaron (2020). ‘Assessing nitrogen dioxide (NO2) levels as a contributing factor to coronavirus (COVID-19) fatality’. Science of The Total Environment, vol. 726.
[1] Interuniversity Department of Regional and Urban Studies and Planning, Politecnico di Torino & Università di Torino
[2] School of Social Science, University of Trento and Department of Economics and Management, University of Florence
[3] Department of Economics and Management, University of Florence and Robert Schuman Centre for Advanced Studies, European University Institute