by Vittorio Valli[*]
This article describes the crucial changes that occurred in the global economic power of major countries in the first part of the XXI Century. In particular, we focus on the changes occurred in terms of economic size, military force, financial power and social cohesion (i.e. some of the pillars of global economic power).
Moreover, in the period 2000-2022 four trends and shocks crucially influenced the global order: (I) diverging trends in terms of energy dependence from foreign sources, with the US almost fully independent thanks to shale oil and shale gas productions, while most of the EU countries have increased their dependence from Russia and other energy exporting countries; (II) a rapid growth in CO2 emissions, triggering global warming and other disruptive effects only tackled by timid and partly ineffective reactions; (III) a sequence of three great shocks (the 2008 financial crisis and the “Great Recession”, the Covid-19 pandemics and the Russian invasion of Ukraine) affected the world economy and, in particular, the Western countries; (IV) Besides economic crises and the disruption or weakening of several global value chains, since 2022, inflation pressures rose rapidly, while traditional restrictive monetary policies seems unbale to tackle without severe social and economic consequences.
Nella prima parte del XXI secolo l’economia mondiale e il potere economico globale dei maggiori paesi hanno avuto cambiamenti cruciali. La dimensione economica, il livello tecnologico, la forza militare, il potere finanziario e la coesione sociale interna di ciascun paese sono le principali determinanti del potere economico globale di un paese
Quattro tendenze o eventi centrali hanno profondamente influenzato l'ordine economico globale negli anni 2000-2022: (I) in termini di dipendenza energetica si registra il rapido sviluppo e il vasto sfruttamento del petrolio e del gas da scisti negli Stati Uniti, che hanno ridotto e poi praticamente eliminato la loro dipendenza energetica, mentre la maggior parte dei paesi dell'UE ha, al contrario, aumentato fortemente la propria dipendenza da gas e petrolio dalla Russia e da altri paesi esportatori di energia. (II) La rapida crescita delle emissioni di CO2 e di altre forme di inquinamento ha portato al riscaldamento globale e ad altri effetti dirompenti, mentre il tentativo di ridurre il riscaldamento globale è stato timido e in parte inefficace. (III) La crisi finanziaria del 2008 e la "Grande Recessione", le pandemie di Covid-19 e l'invasione russa dell'Ucraina sono stati tre grandi shock per l'economia mondiale e in particolare per i paesi occidentali. (IV) alle crisi economiche e alla rottura o l'indebolimento di diverse catene globali del valore si aggiunge, nel 2022, il rapido aumento delle pressioni inflazionistiche, che le consuete politiche monetarie restrittive non possono facilmente affrontare senza determinare gravi recessioni economiche e conseguenze sociali.
Changes in global economic power
In the first part of the XXI Century, the world economy has undergone crucial changes in the global economic power of major countries. Global economic power is principally determined by the economic size, technological and military levels, financial power and internal social cohesion of each country (Figure 1).
Figure 1. Global economic power
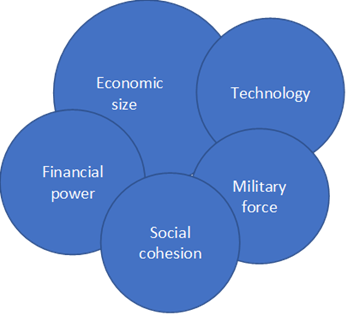
However, it is also extremely important to consider the international economic and financial relations of a country taking into account the different power of the various countries and the phases of globalization and world economic development. Since 2008 most countries have been exposed in various degrees to the consequences of financial crises and the “great recession”, trade conflicts, Covid-19 pandemic and its social and economic impact, wars, embargos, periods of fragilization of global value chains, logistic problems, more arduous and costly access to energy and other strategic raw materials, inflation spurts, severe environmental problems. All this has contributed to change international economic relations, fragmenting the global economy and slowing down world economic development.
Changes in economic size
In terms of economic size, roughly measured by total GDP in PPP, China has overtaken the United States since 2016; in the 2000-2021 years India has overtaken Japan and Germany; Indonesia and Brazil have overtaken France and the UK, while Mexico, Turkey and South Korea have approached the level of Italy (Table 1).
Of course, China and India have a very large economic size also because of their immense population (over 1.4 billion people for China and India versus about 335 million for the US and 280 for Indonesia), but in the 2000-2021 years also their per capita GDP and their productivity have increased much faster than in the US, the other Western countries and Japan.
In the 2000-2021 years, in terms of per capita GDP in PPP, the gap between Western countries and some of the main emerging countries has rapidly diminished, though remaining large.
Table 1. Changes in economic size (GDP in PPP in current international US $).
|
Rank 2021 |
Countries |
2000 |
2007 |
2019 |
2021 |
|
1 |
China |
35.9 |
62.1 |
109.7 |
118.8 |
|
2 |
USA |
100.0 |
100.0 |
100.0 |
100.0 |
|
3 |
India |
21.6 |
28.9 |
44.6 |
44.4 |
|
4 |
Japan |
33.8 |
31.0 |
25.0 |
23.5 |
|
5 |
Germany |
21.9 |
20.7 |
21.6 |
21.0 |
|
6 |
Russian Federation |
9.8 |
16.4 |
20.6 |
20.8 |
|
7 |
Indonesia |
9.8 |
11.6 |
15.6 |
15.5 |
|
8 |
Brazil |
15.4 |
16.5 |
15.2 |
14.9 |
|
9 |
France |
15.5 |
15.0 |
15.4 |
14.9 |
|
10 |
United Kingdom |
15.2 |
15.1 |
15.3 |
14.5 |
|
11 |
Italy |
15.0 |
13.8 |
12.4 |
11.8 |
|
12 |
Mexico |
10.7 |
10.8 |
11.8 |
11.3 |
|
13 |
Turkey |
5.9 |
7.2 |
10.5 |
11.3 |
|
14 |
South Korea |
8.5 |
9.7 |
10.4 |
10.6 |
|
15 |
Canada |
8.8 |
9.0 |
8.7 |
8.7 |
|
16 |
Spain |
8.5 |
10.0 |
9.2 |
8.4 |
|
17 |
Saudi Arabia |
8.0 |
8.6 |
7.9 |
7.6 |
|
18 |
Australia |
4.9 |
5.3 |
5.7 |
6.2 |
Source: World Bank (2022). Our elaborations.
For example, China in the year 2000 had a per capita GDP in PPP equal to 8% of the one of the USA, 27.9% in 2021; India in 2000 had 5.8% of the US level, 10.6 % in 2021; Indonesia went up from 13% to 18.6%; Turkey from 26.5 % to 44%. However, some other countries, such as Brazil (which went down from 24.9% to 23.2%) and Mexico (which went down from 30.5% to 28.9%), had a rather disappointing performance. Table 2 shows a more detailed comparison between the USA and China, the two dominant economies in the XXI Century[1].
The rapid catching up in per capita GDP in some emerging countries is largely due to a substantial catching up in productivity[2], at least in the formal part of the economy. It is also mainly due to industrialization, the scale economies and the rise of some modern services, the increase in physical and human capital and in technological level and a positive insertion in the globalization process.
Table 2. USA and China: selected indicators
|
Indicators |
USA |
CHINA |
||
|
|
2000 |
2021 |
2000 |
2021 |
|
1. Population as % of USA |
100.0 |
100.0 |
446.5 |
425.4 |
|
2. Total GDP in PPP as % of the US |
100.0 |
100.0 |
35.9 |
118.8 |
|
3. Per capita GDP in PPP as % of the US |
100.0 |
100.0 |
8.0 |
27.9 |
|
4. GDP per person employed in constant 2017 PPP $ as % of the US |
100.0 |
100.0 |
6.1 |
24.5 |
|
5. Capital stock in US dollars 2017 as % of the US (a) |
100.0 |
100.0 |
28.0 |
147.3 |
|
6. Gross capital formation as % of GDP (b) |
24.0 |
21.0 |
34.0 |
43.0 |
|
7. Mean years of schooling of adult population (25+ years) |
12.7 |
13.7 |
6.5 |
7.6 |
|
8. Expected years of schooling (c) |
15.1 |
16.3 |
9.9 |
14.2 |
|
9. Spending in R.& D. as % of GDP (b) |
2.6 |
3.4 |
0.9 |
2.4 |
Notes: (a) 2019 instead of 2021; (b) 2020 instead of 2021: (c) 2001 instead of 2000 for China.
Sources: World bank (2022) for indicators 1-4; FRED (2022) for indicator 5; World Bank (2022) for indicator 6; UNDP (2022) for indicators 7 and 8; OECD (2022) for indicator 9. Our elaborations.
Military Force
In terms of military force, the US has remained the leading power and the Russian Federation maintains its enormous arsenal of nuclear and conventional weapons, but China is rapidly rising, massively increasing its army, navy and air-space forces and its technological level in the military field (Table 3). From 2000 to 2021 global military spending increased by about 80% in constant US$. In 2021 the first five big spenders were the USA (801 current billion $; 37.9% of global spending) China (293 B $; 13.9%), India (76.6 B $; 3.6%), UK (68.4 B $; 3.2%), Russia (65.9 B $; 3.1%)[3]. Of course, in 2022, due to the Russian invasion of Ukraine, the two conflicting countries and the ones supporting Ukraine have sharply increased their military budget.
Moreover, India and countries such as Japan, South Korea and North Korea, Pakistan, Brazil, Egypt, Turkey, Iran, Indonesia, Saudi Arabia and Israel, are striving to expand their military force. France and the UK maintain a solid position in terms of nuclear and air-force equipment, but in an ancillary way to the US military power under the NATO umbrella. After the start of the Ukraine war Germany, Poland and other countries have recently announced a sharp increase in their military budget.
Table 3. Index of military strength
|
Rank |
Countries |
Global firepower index |
Rank |
Countries |
Global firepower index |
|
1 |
United States |
0.0453 |
11 |
Italy |
0.1801 |
|
2 |
Russian Federation |
0.0501 |
12 |
Egypt |
0.1869 |
|
3 |
China |
0.0511 |
13 |
Turkey |
0.1961 |
|
4 |
India |
0.0979 |
14 |
Iran |
0.2104 |
|
5 |
Japan |
0.1195 |
15 |
Indonesia |
0.2251 |
|
6 |
South Korea |
0.1261 |
16 |
Germany |
0.2322 |
|
7 |
France |
0.1283 |
17 |
Australia |
0.2377 |
|
8 |
United Kingdom |
0.1382 |
18 |
Israel |
0.2621 |
|
9 |
Pakistan |
0.1572 |
19 |
Spain |
0.2901 |
|
10 |
Brazil |
0.1695 |
20 |
Saudi Arabia |
0.2966 |
Notes: The Index of military strength derives from a number of indicators of military strength, but excludes nuclear capabilities. Ukraine is 22nd, North Korea is 30th.
Source: Global firepower (2022).
Financial Power
In the important field of global financial power, the United States, EU, China, Japan, UK maintain a strong leadership, but Canada, South Korea, India, Brazil, some oil-rich countries are improving the size, attractiveness and sophistication of their financial markets. As it happened in China in the last three decades, in the long run, with a considerable delay, the rise of an economy usually contributes to determine the rise of its financial strength (Table 4 shows the stock market capitalization of listed domestic companies, which represents a rough and partial, albeit important, aspect of financial power).
Although China has an excessive debt position in several of its main public enterprises and in some private ones, and it is plagued by the consequences of the three great shocks in the world economy, the extremely large saving rate of its population can contribute to sustain the gradual strengthening of its financial system. India’s economic development is also sustaining the growth of Indian financial system. However, the sharp formal-informal duality of India’s economy and the lower saving rate of India with respect to China limit the growth rate of its financial sector and the access of a large part of the population to modern financial services.
In Brazil the growth of the financial sector has been limited by the unstable trend of its economy in the last two decades and the large inequalities persisting in its economy, in which the wealth position of a consistent part of its population is largely negative.
Table 4. Stock market capitalization of listed domestic companies in 2020 and 2003
|
Rank 2020 |
Country |
2020 |
2003 |
Rank 2020 |
Country |
2020 |
2003 |
|
1 |
USA |
40720 |
14266 |
11 |
Australia |
1721 |
586 |
|
2 |
China |
12214 |
513 |
12 |
Iran |
1218 |
27 |
|
3 |
Japan |
6718 |
2953 |
13 |
South Africa |
1051 |
261 |
|
4 |
Hong Kong |
6130 |
715 |
14 |
Brazil |
988 |
235 |
|
5 |
Canada |
2641 |
910 |
15 |
Spain |
759 |
726 |
|
6 |
India |
2595 |
309 |
16 |
Russia |
695 |
….. |
|
7 |
Saudi Arabia |
2429 |
….. |
17 |
Singapore |
653 |
148 |
|
8 |
Germany |
2284 |
1079 |
18 |
Thailand |
543 |
119 |
|
9 |
South Korea |
2176 |
329 |
19 |
Indonesia |
469 |
55 |
|
10 |
Switzerland |
2002 |
727 |
20 |
Malaysia |
437 |
161 |
Notes: Some financially important countries such as UK, France, Italy are not included in the table because for them World Bank’s data cover only the period up to 2014 (2018 for France).
Source: World Bank (2022 b). Values in current billion US dollars.
Social Cohesion
A country can have an important economic size and a good level of technology and competitiveness, but a bad score in social cohesion.
From the economic point of view, social cohesion mainly depends on the level of inequality and of social mobility, i.e. the possibility to up-grade the economic and social status of a person. It depends also on the level of discrimination and the respect of basic civil rights. Authoritarian governments ruling through heavy police and military repression and feeding inequalities, discriminations, and nationalistic impulses, often lead to wars or revolts. In the long run all this conducts to the loss of social cohesion, the collapse of the regime and a severe economic crisis.
From 2000 to 2021 within-country global income inequality has badly increased, while between-country inequality has decreased[4]. In the US, Japan and in some EU countries, as well as in China, India, Brazil, Indonesia, South Korea, the percentage of total income owned by the top 10% of population has increased, while the percentage owned by the bottom 50% has decreased or stagnated. In 2021 Mexico, Brazil, India, Indonesia and the USA had huge differences between the top 10% adult population and the bottom 50%; a little less Russia, China, Nigeria, South Korea and Japan. Substantial, but smaller differences existed in Germany, UK, Italy and France (Table 5). The income gap, defined as the ratio between the average income of the top 10% of adult population and the average income of the bottom 50%, was enormous in Mexico, Brazil and India; very large in India, Indonesia and the US; large in Russia, China, Nigeria, South Korea and Japan; lower, but significant, in Germany, UK, Italy and France.
Table 5. Inequality in income and wealth in selected countries (2021)
|
Countries |
% share of the bottom 50% |
% share of the middle 40% |
% share of the top 10% |
% share of the top 1% |
||||
|
|
income |
wealth |
income |
wealth |
income |
wealth |
income |
wealth |
|
Mexico |
9.2 |
-0.2 |
33.5 |
21.5 |
57.4 |
78.7 |
26.1 |
46.9 |
|
Brazil |
10.1 |
-0.4 |
31.4 |
20.6 |
58.6 |
79.8 |
26.6 |
48.9 |
|
India |
13.1 |
5.9 |
29.7 |
29.5 |
57.1 |
64.6 |
21.7 |
33.0 |
|
Indonesia |
12.4 |
5.5 |
39.6 |
34.3 |
48.0 |
60.2 |
18.3 |
29.4 |
|
USA |
13.3 |
1.5 |
41.2 |
27.8 |
45.5 |
70.7 |
18.8 |
34.9 |
|
Russia |
17.0 |
3.1 |
36.6 |
22.8 |
46.4 |
74.1 |
21.5 |
47.7 |
|
China |
14.4 |
6.4 |
44.0 |
25.8 |
41.7 |
67.8 |
14.0 |
30.5 |
|
Nigeria |
15.5 |
5.7 |
41.8 |
36.2 |
42.7 |
58.1 |
11.6 |
25.2 |
|
South Korea |
16.0 |
5.6 |
37.5 |
35.9 |
46.5 |
58.5 |
14.7 |
25.4 |
|
Japan |
16.8 |
5.8 |
38.3 |
36.5 |
44.9 |
57.8 |
13.1 |
24.5 |
|
Germany |
19.0 |
3.4 |
43.9 |
37.1 |
37.1 |
59.6 |
12.8 |
29.7 |
|
UK |
20.4 |
4.6 |
44.0 |
38.2 |
35.7 |
57.1 |
12.7 |
21.3 |
|
Italy |
20.7 |
10.0 |
47.1 |
42.4 |
32.2 |
47.7 |
8.7 |
18.0 |
|
France |
22.7 |
4.9 |
45.1 |
35.6 |
32.2 |
59.5 |
9.8 |
27.0 |
Notes: The data refer to adult population in 2021.
Sources: WIR (2022) and WID (2022).
As to the wealth gap between the top 10% and the bottom 50%, the situation was in general much worse. Mexico, Brazil, the US and Russia had enormous wealth gaps; Germany, the UK, France, China, South Korea, Nigeria and Japan had a very large one, while Italy had a lower one mainly because of the diffusion of some ownership of the first house in a section of the bottom 50% of adult population, partly due to the scarcity of low-rent housing (Table 6).
The economic crisis of the lower middle class and the poor has contributed to the creation of various forms of populism in several countries.
In the long run various form of discriminations between genders, ethnic groups, etc., as well as the negation of some basic civil rights, have contributed to weaken internal social consensus in several countries, especially in periods of prolonged economic stagnation.
Table 6. Income and wealth gaps in selected countries in 2021
|
Countries |
Income gap |
Wealth gap |
|
Mexico |
1 to 31 |
------- |
|
Brazil |
1 to 29 |
-------- |
|
India |
1 to 22 |
1 to 55 |
|
Indonesia |
1 to 19 |
1 to 54 |
|
USA |
1 to 17 |
1 to 236 |
|
Russia |
1 to 14 |
1 to 118 |
|
China |
1 to 14 |
1 to 53 |
|
Nigeria |
1 to 14 |
1 to 51 |
|
South Korea |
1 to 14 |
1 to 52 |
|
Japan |
1 to 13 |
1 to 50 |
|
Germany |
1 to 10 |
1 to 89 |
|
UK |
1 to 9 |
1 to 61 |
|
Italy |
1 to 8 |
1 to 24 |
|
France |
1 to 7 |
1 to 61 |
Notes: Income gap is the average income of the bottom 50% of adult population vis-a vis the average income of the top 10%. Wealth gap is the average wealth of the bottom 50% of adult population vis-a vis the average wealth of the top 10%. Mexico and Brazil had in 2021 an average negative wealth, i.e. a debt position.
Sources: WIR (2022) and WID (2022).
Crucial trends and great shocks in the 2000-2022 years
Some crucial trends and three main shocks have deeply influenced the global economic order in the 2000-2022 years.
First, since 2006 the rapid development and vast exploitation of shale oil and shale gas in the United States have reduced, and then practically eliminated, the US energy dependence from foreign sources, though heavily increasing the pollution in the extraction zones and reducing the US propensity to expand renewables. In the same period, before the Russian invasion of Ukraine, most EU countries have, on the contrary, strongly increased their gas and oil dependence from Russia and other energy exporting countries and have too slowly increased the recourse to renewables.
Second, the rapid growth of CO2 emissions and other forms of pollution have brought global warming, water scarcity, devastating weather perturbations and other disruptive effects, contributing to reduce global economic growth and produce famine and massive migrations. The attempt to reduce global warming has been timid, and partly ineffective. One important reason consists in the fact that poor countries and some emerging ones usually have low per capita emissions and need more energy in order to grow and this will increase emissions, while several richer countries are not substantially decreasing their very high per capita emissions. Table 7 gives an idea of how the global situation both for total and per capita emissions have continued worsening in the 2000-2021 period. In 2021 rich countries such as the USA, South Korea, Japan and the EU 27, plus the main energy- exporters, such as Saudi Arabia, Russia and Iran, had per capita CO2 emissions much higher than the world average, though their trend in the 2000-2021 period has been different (somewhat diminishing in the USA, EU 27 and Japan while rising in all the other countries listed in Table 7).
In the 2000s Africa had very low and stagnating per capita CO2 emissions (1.04 t. in 2021), but very heavy consequences of global warming in terms of drought, water scarcity, bad crops, weather turbulences, famines and migrations.
Table 7. CO2 Emissions in selected countries (2000-2021)
|
Countries |
Total emissions Billion tonnes |
2000-2021 % change |
Countries |
Per capita emissions (tonnes) |
2000-2021 % change |
||
|
2000 |
2021 |
2000 |
2021 |
||||
|
WORLD |
25.45 |
37.12 |
+46% |
WORLD |
4.14 |
4.69 |
+13% |
|
China |
3.64 |
11.47 |
+215% |
Saudi Arabia |
13.75 |
18.70 |
+36% |
|
USA |
6.02 |
5.01 |
-17% |
USA |
21.30 |
14.86 |
-30% |
|
EU (27) |
3.60 |
2.79 |
-22% |
Russia |
10.07 |
12.10 |
+20% |
|
India |
0.98 |
2.71 |
+177% |
South Korea |
9.40 |
11.89 |
+26% |
|
Russia |
1.48 |
1.76 |
+19% |
Japan |
9.97 |
8.57 |
-14% |
|
Japan |
1.26 |
1.07 |
-16% |
Iran |
5.63 |
8.52 |
+51% |
|
Iran |
0.37 |
0.75 |
+103% |
Germany |
11.03 |
8.09 |
-27% |
|
Germany |
0.90 |
0.67 |
-25% |
China |
2.88 |
8.05 |
+179% |
|
Saudi Arabia |
0.30 |
0.67 |
+127% |
EU (27) |
8.44 |
6.28 |
-26% |
|
Indonesia |
0.28 |
0.62 |
+124% |
Indonesia |
1.29 |
2.26 |
+75% |
|
South Korea |
0.44 |
0.62 |
+40% |
India |
0.92 |
1.93 |
+109% |
Source: Our World in Data (2022)
Third, the 2008 financial crisis and the “Great Recession”, the Covid-19 pandemics and the Russian invasion of Ukraine have been three great shocks to the world economy and in particular to Western countries, with important adverse consequences also for emerging and developing countries.
Four great lessons from these crises have been largely forgotten. The 2007-8 US financial crisis and the consequent great recession are basically due to the de-regulation of the financial system since the 1990s and to decades of excessive financialization of the world economy. Little has been made to structurally face these two problems.
Moreover, the “austerity” measures followed in most countries at the start of the “great recession” have proved to be as fuel thrown on the fire of the economic crisis. Therefore, we must device mechanisms which can sustain the economies during the crises and restore stability during the expansions.
The COVID-19 pandemic has shown how a well-organized and well financed public health system is important to avoid, or significantly reduce, great pains in terms of deaths, long and sorrowful hospitalizations and economic disruption. The budget cuts made in the 1990s and 2000s in several countries in their public health system have backfired contributing to severely reduce the possibility to promptly and effectively react to the pandemic.
The brutal Russian invasion of Ukraine and all the other wars or harsh social-political conflicts raging in the last two decades in Afghanistan and several parts of the Middle East, Africa, America, Asia and Europe remind us the inner fragility of an international order essentially based on economic and military strength and full of nationalistic, or ethnic and religious divisions amplified by power-seeking political leaders.
The impotence of the United Nations in solving international conflicts is crying for a radical reform of this institution. Wars badly contribute to destroy lives, communities, housing and infrastructures and to create poverty and massive migrations. The rapidly increase of war drones, missiles and other lethal instruments operating at distance and so decoupling the attacks from the direct sacrifice of soldiers, is raising the risk of wars and terrorism.
Fourth, the lack of regulation of globalization and, since 2008, the slowing down of the process of globalization, partly due to the three great shocks, have contributed to produce economic crises, the disruption or weakening of several global value chains and, in 2022, the rapid rise of inflation pressures. It has also increased the feeling that, in turbulent or war-time periods, the excessive dependence from other countries for strategic materials, such as energy sources, rare earth, chips, batteries and food, can be very dangerous. Severe bottlenecks in the global supply chain can lead to shortages in production and to inflation spurts, which the usual restrictive monetary policies cannot easily face without determining severe economic recessions and the rise of unemployment, economic and social inequalities, poverty and famine.
Globalization is not ending but is slowing down and the global economy is more and more fragmented.
References
Global firepower (2022), https://www.globalfirepower.com/countries-listing.php, retrieved on November 2, 2022.
OECD (2022), Gross domestic spending in R&D as % of GDP, retrieved on November 21, 2022.
< https://data.oecd.org/rd/gross-domestic-spending-on-r-d.htm >
Our World in Data (2022), < https://ourworldindata.org/co2-emissions > retrieved on November 10, 2022.
SIPRI (2022), < https://www.sipri.org/research/armament-and-disarmament/arms-and-military-expenditure/military-expenditure > and < https://www.sipri.org/media/press-release/2022/world-military-expenditure-passes-2-trillion-first-time > , retrieved in January 30, 2023.
UNDP (2022), Human Development Report 2021-22, < https://hdr.undp.org/content/human-development-report-2021-22 >
Valli V., (2018), The American Economy from Roosevelt to Trump, Palgrave Macmillan, London.
Valli V. (2021) The Power of Technology in the US and China: A Comparison. In: Andreff W. (eds) Comparative Economic Studies in Europe. Studies in Economic Transition. Palgrave Macmillan, London.
WID (2022), World Inequality database, < https://wid.world/ > retrieved on November 9, 2022
WIR (2022), World Inequality Report, < https://wir2022.wid.world/ > , retrieved on November 9, 2022.
World Bank (2021), Global productivity. Trends, Drivers and Policies, World Bank Group, Washington D.C.
World Bank (2022 a), GDP in PPP in current international $. Retrieved on November 6, 2022, https://data.worldbank.org/indicator/NY.GDP.MKTP.PP.CD
World Bank (2022 b). Market capitalization of listed domestic companies, Retrieved on November 8, 2022. https://data.worldbank.org/indicator/CM.MKT.LCAP.CD?locations=US
[*] Professor emeritus of Economic Policy at the University of Turin, president of OEET.
[1] For a more detailed analysis of the technological power of China and the US, see Valli (2021).
[2] See World Bank (2021).
[3] Source: SIPRI (2022).
[4] See WIR (2022), p.57.